Nifty 50 Daily Chart Analysis - February 21, 2024Technical Analysis:
Candle Pattern: The daily chart for February 21st shows a "Bearish Engulfing" pattern. This indicates a potential reversal in the upward trend, as the current day's candle completely engulfs the previous day's price range.
Moving Averages: All major moving averages are still bullish, but the recent candle suggests a possible slowdown in the upward momentum.
Support and Resistance:
Immediate support: 21,920
Key support: 21,600
Resistance: 22,450 - 22,500
Indicators:
RSI: Currently at 67, nearing overbought territory, suggesting a potential pullback.
MACD: Still bullish, but the histogram shows a weakening momentum.
Key Observations:
The Nifty 50 has been consolidating near the recent highs for the past few days.
The Bearish Engulfing pattern suggests a potential pullback in the near term.
Overbought technical indicators also suggest a potential correction.
However, the long-term trend remains upward, supported by bullish moving averages.
Other Observations:
The market opened higher but faced selling pressure later in the day, leading to the Bearish Engulfing pattern.
FII activity shows some reduction in short positions, suggesting cautious optimism.
The IPO of Purv Flexipack on February 27th could potentially impact market volatility.
Overall:
The Nifty 50 is currently at a crossroads. While the technical indicators still favor the upward trend, the Bearish Engulfing pattern and overbought conditions raise concerns about a potential pullback. The next few days will be crucial to see if the market can maintain its momentum or succumb to selling pressure.
Important Note:
This analysis is for informational purposes only and should not be considered financial advice. Please consult a qualified financial advisor before making any investment decisions.
Search in ideas for "NIFTY 50"

NIFTY 50 Analysis For Feb 21st!Hello Traders,
Here is a Brief Overview About The Analysis of NIFTY 50 For Feb 21st,
There Are Total of one Support Zones Which You Need To Look And To Be Mentioned One Grey Area And We Have one Imbalance Zone!
The Horizontal Lines From Volume To Volume And OI To OI Indicates The Market Range in Between For That Particular Day!
The Blue Arrow Path Showing The Direction of The NIFTY 50 For That Day.
Note : Those Levels Are Only For That Particular Day.
Please Note That The Only Purpose of The Information On This Page is Purely Educational.
We Are Not Registered with SEBI; Therefore, Before Making Any Financial Decisions OR Investing, Please Consult with A SEBI-Qualified Financial Advisor. We Don't Have Any Responsibility For Your Profits OR Losses.
I Would Welcome Your Participation And Support in the Form of Likes, Comments, And Follow us to Offer Some Encouragement.
Thank You.

NIFTY 50 Analysis For Feb 16th!Hello Traders,
Here is a Brief Overview About The Analysis of NIFTY 50 For Feb 16th,
There Are Total of 2 Support Zones Which You Need To Look For And Same 2 Resistance Zones And To Be Mentioned One Grey Area.
The Horizontal Lines From Volume To Volume And OI To OI Indicates The Market Range in Between For That Particular Day!
The Blue Arrow Path Showing The Direction of The Nifty 50 For Tomorrow.
Note : Those Levels Are Only For That Particular Day.
Please Note That The Only Purpose of The Information On This Page is Purely Educational.
We Are Not Registered with SEBI; Therefore, Before Making Any Financial Decisions OR Investing, Please Consult with A SEBI-Qualified Financial Advisor. We Don't Have Any Responsibility For Your Profits OR Losses.
I Would Welcome Your Participation And Support in the Form of Likes, Comments, And Follow us to Offer Some Encouragement.
Thank You.

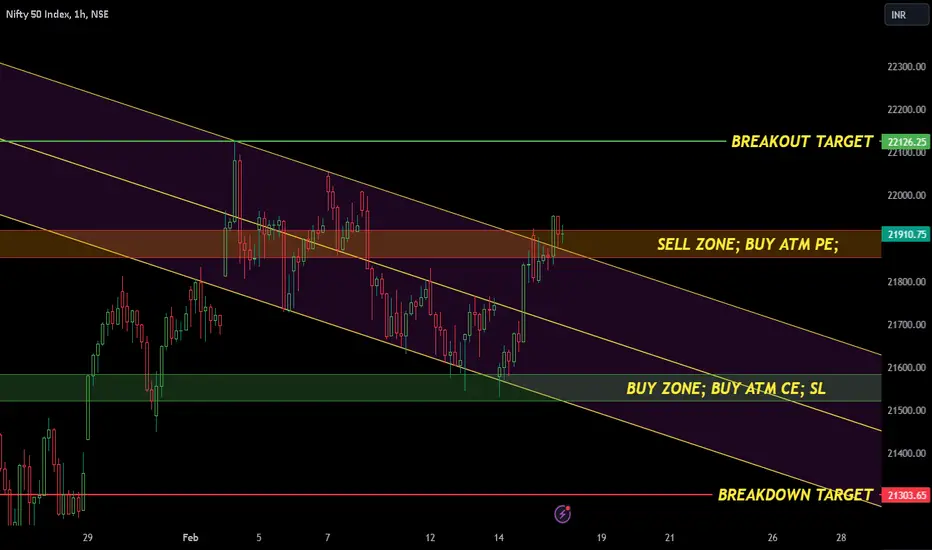
Nifty 50 - !st Barrier Broken TodayAs per the previous Nifty 50 expiry discussion, Nifty 50 crossed above 1st of the 2 resistances (Top Line Parallel Pattern & Sell Zone Area). Still the chances for REVERSAL is NOT over so far.
Key Points for tomorrow:
1. Bullish = Open above the sell zone & continue moving upwards.
2. Bearish = Reversal can occur near the sell zone near 22000.
My Personal Opinion = Long
Wait, Watch & Observe.
Nifty 50 Analysis: Identifying Profit Booking and Gap Filling In this Nifty 50 analysis, we pinpoint potential opportunities for traders. The profit booking zone is identified between 21,792 and 21,828, presenting a strategic range for profit-taking. Additionally, keep an eye on the gap filling zone spanning from 21,974 to 22,019, offering insights into potential market movements.
For traders seeking breakout opportunities, the Nifty 50 presents an intriguing scenario. Assess the market dynamics carefully and consider breakout trading strategies to capitalize on potential price movements. Stay vigilant and make informed decisions in this dynamic trading environment.
Note: For education purpose only. Trading involves risks, and it's crucial to conduct thorough research and risk management before making any trading decisions.

Nifty 50 is forming diametric patternNifty 50 seems to be forming a diametric pattern which is targeting 20708.
Currently wave (e) is being completed and after that we have to wait for a decrease of almost 2% in the form of wave f and the upward trend of Nifty 50 will start again.

Nifty 50 Weekly Market OutlookWeekly Review
Nifty 50 continued to fall for the 5th week straight. The index has retraced -3.64% from its all-time highs. Although in mid-week bulls tried to outnumber the bears as index witnessed a good rally till 19,585 levels but was soon rejected as it faced huge selling pressure pushing the index to 19,265 with a gap down opening the very last day of the week.
Week Ahead :
On Daily charts, the Nifty 50 index seems to form a falling wedge which shouldn’t go unoticed as we have seen a euphoric rally in past mid week. This indicates a strong push by bulls to regain their fort but that’s a conditional outlook if the index is breached beyond the falling trendline (downward sloping-upper trendline) with sustained move till 19,300-19,375. A break above 19,600 is a crucial resistance for any rally beyond that level and given the fact that market still holds 19,494 as crucial level. On the lower side if the selling pressure weighs heavy, a possibility of 19,194 , 19,076 and 18,977 can’t be ignored.

Nifty 50 viewsRecently trading the index was not possible for me till now as I am not having conviction as such, based on my understanding of levels and zones which I can understand based on volume price action-based trading. So, most of my post were based on stock-based analysis.
Based on my understanding which is debatable as such, I feel it is 1st time nifty 50 has attempted to give me some clues about its trading style after a while.
Now, as of today's price action is concerned, I know surely nifty 50 has attempted to be more generous to me and that is why I am posting my drawing and with no views as such.
But it is important for the formation of the views and to communicate with the chart, this is a genuine attempt to calibrate the future movement of the script or indices.

Nifty 50 BTST/Intraday Breakout20 SMA has crossed above 50 SMA in the 30 Mins Time frame, A breakout has also occurred. Nifty 50 looks to turn bullish in the short time frame which can be utilized.
Entry @ 17100
SL @ - 0.5%
TP1 @ 1.5%
TP2 @ 2.0%
Note: Only for educational purposes. DYOR before trading or investing.

NIFTY 50 15MIN TF-ANALYSIS (DEC 19)Hello TradingView community and my followers, please if you like the ideas, don't forget to support them with likes and comments, thank you very much and here we go.
.
NIFTY 50
Daily : Nifty 50 is in uptrend.
15 min : It has made Descending channel and currently at support level.
*Wait and see how price reacts near support level then find opportunity.
THANK YOU !!!!

Nifty 50 - Market Sell Long PossibleThe NIFTY 50 is a benchmark Indian stock market index that represents the weighted average of 50 of the largest Indian companies listed on the National Stock Exchange. It is one of the two main stock indices used in India, the other being the BSE SENSEX

nifty 50 tomorrow option CE sidetomorrow there may b recovery in nifty 50
options buyer in nifty 50 focus on call side once 15 min chart break the day high

Nifty 50 Intraday Trade Setup for 05th July 2022Nifty50 Index on Monday snapped a three-day losing streak and closed higher on Monday. The U.S. market was closed for a holiday yesterday and hence in the absence of strong global cues, we are likely to see a flat or slightly positive opening. We are still in the declining markets which are always tough for intraday traders because of the sudden up and downside moves and one must be ready for it.
Nifty 50 Index – Daily TF
After hitting a fresh 52-week low of 15,183, the index has given a good recovery and has stopped making lower lows. The index is consolidating in the wider range is 15,950 / 16,000 to 15,500 with a positive bias. A sustainable up-move above 16,000 (psychological resistance) will activate the XABCD pattern and is expected to pull the Index towards the next resistance of 16,300 and then towards 16,600 after gap fill. If the index fails to sustain 15,500, it can retest the previous swing low of 15,180/200 and we can see more fall below these levels to 14450/500(ABCD pattern getting activated).
Nifty 50 Index – 2Hr TF
The index is taking support from the dynamic trendline and is facing multiple rejections on the upside forming an ascending triangle pattern. A fresh uptrend rally is possible if the index breaks out and sustains 15,950/16000 levels and the index can test 16,300. However, if the index fails to sustain the previous swing low (15,500), it can fuel a downfall to 15350/15,200 levels.

NIFTY 50 BEARISH CROSS OVER OF MACD 1) MACD Hhas done a bearish Crossover on the Monthly NIFTY 50 CHART .
2) NIFTY 50 Monthly RSI forming lower lows
3) Last time the monthly MACD did a Bullish Crossover in Oct 20 we had a Long term secular Bull Rum.4) DOES THE BEARISH CROSS OVER IMPLY A LONG TERM SECULAR BEAR TREND .
4) Does the Monthly MACD crossover mean a secular Bearish Trend
ONLY TIME WILL TELL

NIFTY 50 SELL INTRADAYlet see chart nifty 50 complete 15 minute chart 5 wave structure and go down side
sell first target down side nifty 50 -- 17100
second target down side 17000

Nifty 50 at 50 Day Moving Average 15900 is the Next SupportThe Nifty in the Bull Market Take Support in the 50dma, the nifty 50 next support is the 15900,

NIFTY 50 MAY 2021As per my view their is a pullback in Nifty 50 after that only Index move upward now nifty 50 looking week.
Disclaimer
I am not sebi registered analyst
My studies are Educational purpose only
Please consult with your Financial advisor before trading or investing

Nifty 50 – Another Rally Before The Wheels Come OffThe Nifty 50 completed a 3-wave correction from its most recent all-time high. We expect another brief spike into the 12,200-12,400 area before the wheels come off.
Indian equities have lost steam recently. Their rally continuation occurred on diverging momentum. This observation hints towards a nearby fade. However, the upside pattern is most likely still incomplete at the time of this write-up. Another brief up sequence completes the c-wave of minute degree within an ending diagonal. Subsequently, the most significant correction since 2016 is likely to unfold. It will be the c-wave of an irregular flat pattern. The flat’s degree is unclear. It could be of an intermediate or primary degree. Whatever it is, it will result in another 20% leg down.
All in all, the Nifty 50 has probably one more spike to the upside left before the next big move to the downside commences.

NIFTY 50 ---- MAYBE NIFTY support level looks between 24000-23890 and also RSI of NIFTY is close to oversold.
Expectation for next week, we may see more dip till support level which will push RSI to oversold zone, and from there bounce back is expected.
If you see the history of NIFTY 50, it has never stayed in oversold zone for more than 2-3 days, only if we have global crisis.
This is just a study based on technical indicators and experience, My study can go wrong.
Hope for the Best.

Nifty 50 Analysis: Head and Shoulders Pattern CompletedEarlier, I shared my personal analysis of Nifty 50, highlighting the formation of a potential head and shoulders pattern. At the time, I noted key levels:
Resistance at 25,400: If Nifty broke above this level, I would wait for confirmation from the next candle before making any moves.
Support at 24,800: A drop below this would signal the start of a downtrend, prompting caution and a hold on trades.
Now, the pattern has fully formed, and the next critical step is to observe tomorrow's candle. If Nifty stays below 24,800, it would confirm the downtrend, signaling a good time to prepare for buying opportunities as stocks become more attractively priced.

Nifty 50 for next week strategy expiry at 6.7.2024my view in Nifty 50 for next week strategy NSE:NIFTY [

Nifty 50 bearish.We can see that the Nifty 50 has reversed from its ATH and formed a similar pattern as it was in March 2024.
Bearish divergence and bearish wedges with a similar trend setup in BankNifty.
If nifty and bank nifty both move in a similar trend we see a smooth one-direction move.
Thursday we may see a gap down opening which could be a strong indication of the breakdown.
Entry, exit & target levels are marked on charts.
Trade wisely #DYDD.

Nifty 50 Daily AnalysisNSE:NIFTY
29/09/2023
Overview -
Most of the Asian Indices showed a better performance on what was the last trading day of the month. The Brent Crude prices remained in the 90s, although decreased in the last few hours.
Nifty 50-
The day opened at 19581 with a gap-up as the 15 minute trendline had been broken, although the day was not ompleteoy sideways as expected.
The markets were under the bullish influence for majority of the day, while it some profit booking was seen in the last hour with markets closing at 19638.
The candle was an inside candle on the daily chart, therefore a clear move can be expected either way when the low or high of the previous candle is broken i.e., over 19761- uptrend and below 19492- downtrend.
Bias for 3/10/2023- As a clear move remains unclear, it will be interesting to see the events over the long weekend with China Manufacturing PMI for September and the Fed Meeting scheduled on Monday.
